A Mini-Course on Machine Learning Visualizations - Part 3
Scree Plot
Usage category: Hyperparameter Tuning
Another way to choose the right number of components in PCA is to create the scree plot which is not much powerful as the cumulative explained variance (CEV) plot, but it is easier to create that with less code.
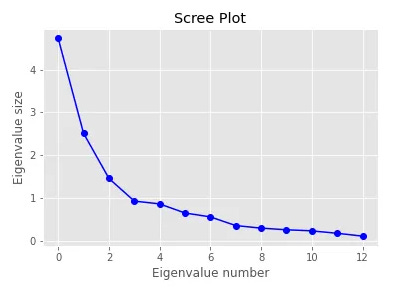
PCA is performed by computing the eigenvalues of the covariance matrix of standardized data. The scree plot is the visual representation of those eigenvalues which define the magnitude of each principal component.
In a scree plot, the x-axis represents the eigenvalue number which begins with the number 0 and the y-axis represents the eigenvalue size. The larger the value, the more valuable the component is.
We select all the components up to the point where the bend occurs in the scree plot. In the above plot, the bend occurs at index 3. So, we decide to select the components at index 0, 1, 2, and 3 (a total of four components). Someone might also select the 5th component at index 4. In that case, we keep the first 5 components (note that indices begin with 0).
We also utilize Kaiser’s rule along with the scree plot for more accurate selections of components. Kaiser’s rule recommends keeping all the components with eigenvalues greater than 1 or close to 1. According to this, we can select the first 5 components and this selection is also matched with our previous selection!
This post is a part of my original post published on Medium.
Designed and written by:
Rukshan Pramoditha on Data Science Masterclass
2023–08–21


